
HARP Provider
Overview
HealthInfoNet’s Health Analytics Reporting Platform (HARP) Provider contains a suite of use case-driven analytics tailored over the years in collaboration with our HIE participants to yield actionable insights for providers and their teams.
Common ways in which our analytics are leveraged include to:
Monitor patients with frequent readmissions or at greater risk of readmission to Inpatient and Emergency Department settings to inform proactive care management
Better target care for patients with chronic conditions to help them prevent medical complications and increased hospitalizations
Identify patients most at risk for future medical conditions, events, and utilization in order to help them avoid unnecessary encounters, tests, and procedures
Identify gaps in quality measurement to help put performance improvement plans in place quicker
Below is a brief overview of the reporting dashboards currently available to HARP users.
Reporting Dashboards
Title | Description |
|---|---|
The Insights reporting dashboard provides a snapshot of aggregate metrics with patient drill-down functionality corresponding to key service workflows. The dashboard offers a jumping-off point for users to target specific patients meeting use-case driven criteria to help improve their health-related risks, conditions, and outcomes. It also serves as a landing page for users to define the attributed patient populations that subsequent reporting dashboards leverage in their analyses. | |
The Patient Profile reporting dashboard provides aggregate information about the personal characteristics of a user’s attributed patients. | |
The Patient Detail reporting dashboard provides detailed information about the personal characteristics for each of a user’s attributed patients. | |
The Risk Profile reporting dashboard provides aggregate information about the predictive risks (and/or present conditions, as applicable) of a user’s attributed patients. For more information, visit the Predictive Risk Modeling methodology section. | |
The Risk Detail reporting dashboard provides detailed information about the predictive risks (and/or present conditions, as applicable) for each of a user’s attributed patients (when available). For more information, visit the Predictive Risk Modeling methodology section. | |
The Risk Features reporting dashboard provides specific information about the variables used to evaluate the predictive risks (and/or present conditions, as applicable) of a user’s attributed patients. For more information, visit the Predictive Risk Modeling methodology section. | |
The Encounter Profile reporting dashboard provides aggregate information about the healthcare utilization (i.e., encounters) of a user’s attributed patients. | |
The Encounter Detail reporting dashboard provides detailed information about the healthcare utilization (i.e., encounters) of a user’s attributed patients. | |
The Performance Measurement reporting dashboard provides aggregate and detailed information about the calculated electronic clinical quality measurement (eCQM) results for a user’s attributed patients. For more information, visit the Quality Performance Measurement methodology section. | |
The NDPP Measurement reporting dashboard provides aggregate and detailed information to help identify a user’s attributed patients who are eligible to participate in the National Diabetes Prevention Program (NDPP). Available measurement was developed in collaboration with the Maine Centers for Disease Control and Prevention (Maine CDC) and the Office of MaineCare Services (OMS). For more information, visit the National Diabetes Prevention Program methodology section. | |
The Address History reporting dashboard provides supplemental address information about a user’s attributed patients. Whereas the Patient Detail reporting dashboard provides attributed patients' most recently reported address information, this dashboard provides all reported address information for the attributed patient over all time. | |
The MaineCare Medications reporting dashboard provides supplemental medication information for a user’s attributed patients. IMPORTANT: This view is limited to the previous 365 days of pharmacy claims information for MaineCare (Medicaid) members only and therefore may not be a comprehensive view of all medications prescribed to the selected patient. For a more comprehensive view into an attributed patient’s medication history, users should refer to the Clinical Portal’s Medication Management component. |
Service Components
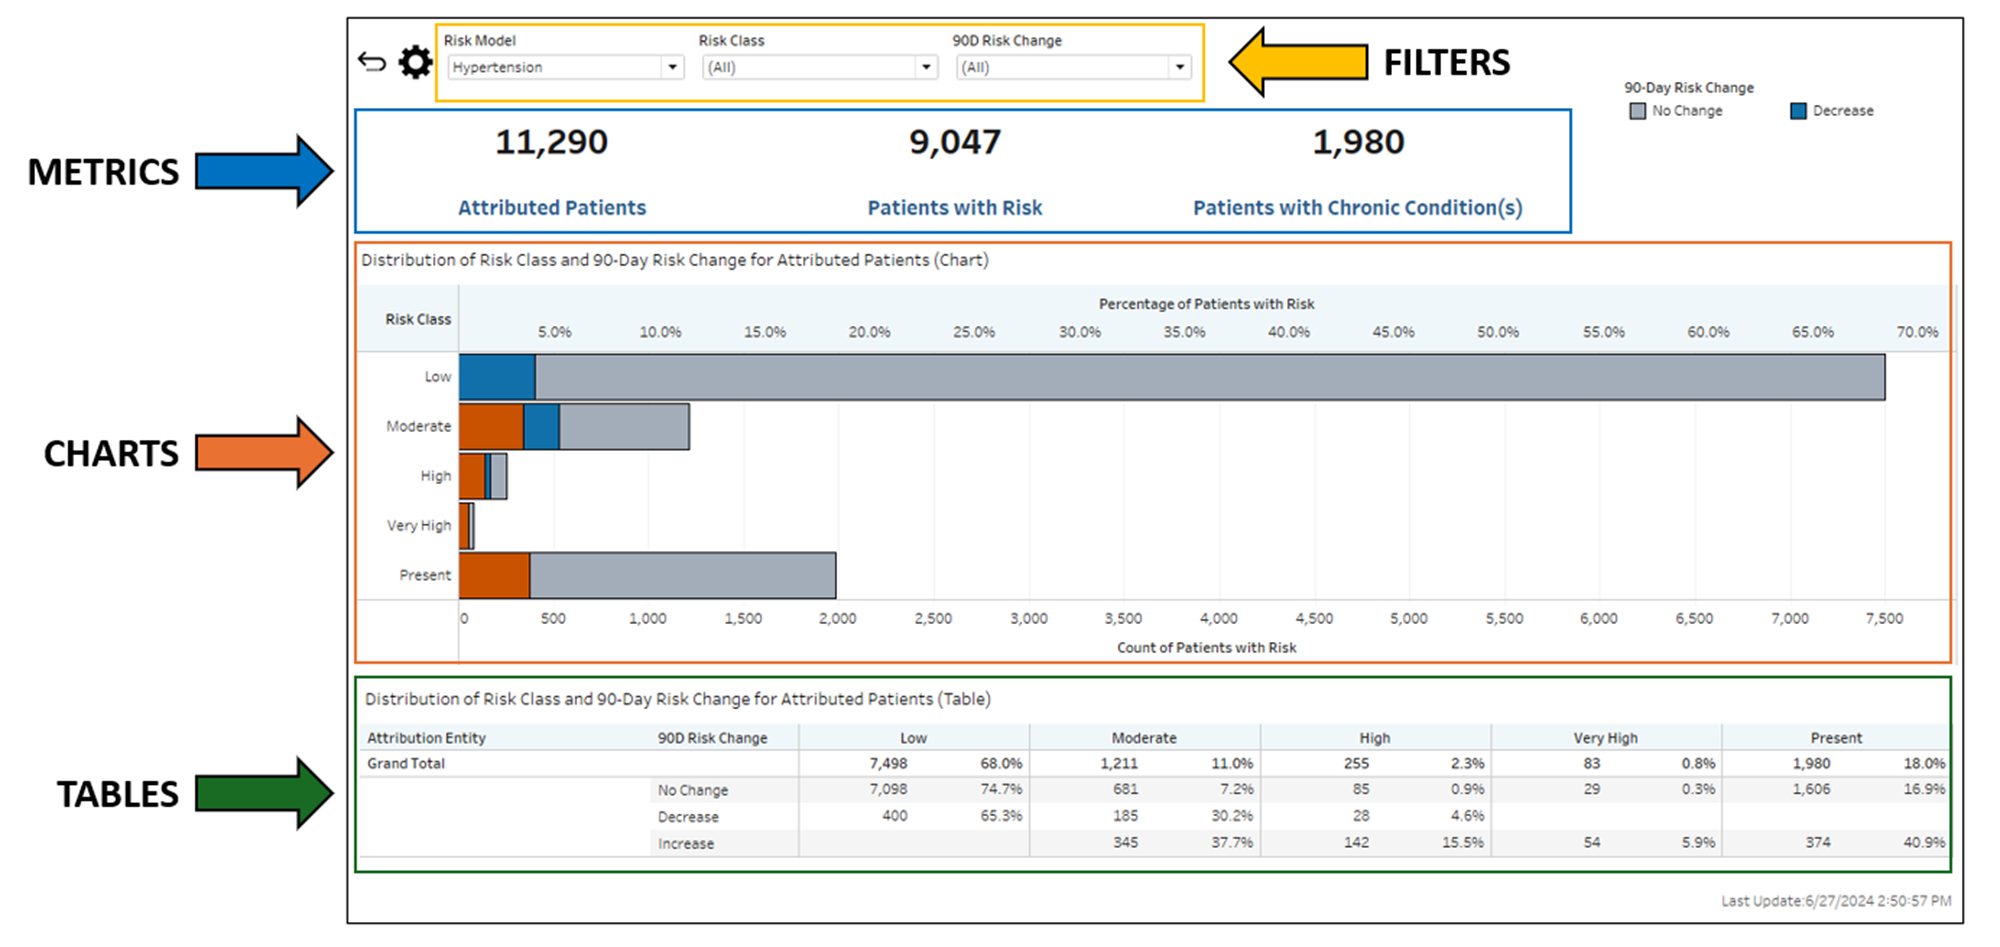
There are several core components throughout HARP that compose the navigation, functionality, and design of the available reporting dashboards. Those components include Filters, Metrics, Charts, Tables, and Linkages. The following sections provide information about the use of each component.
The annotated screenshots below visually identifies those components for reference.
Component | Description |
|---|---|
Filters | There are two primary means of refining the information available within reporting dashboards:
Note: When specific values are selected in certain filters, other available filters' values may automatically limit to display only the remaining relevant values. For example, a user may select the “Male” value from the Sex filter. If the user subsequently wishes to limit their attributed patient population using the Race filter, the remaining values available in the filter will reflect the specific race categories of the user’s attributed Male patient population. For more information about how to use filters to optimize query performance and trace selections, visit the Service Controls section. |
Metrics | Included in each reporting dashboard are a few aggregate metric calculations that have been designed to help orient users as they begin to understand and interpret the information available within the views. |
Charts | Included in certain aggregate-level reporting dashboards are charts that help visualize key trends, patterns, and insights based on top use cases and workflows. |
Tables | Included in certain aggregate-level reporting dashboards and in all detailed-level reporting dashboards are tables that provide underlying data sets for deep-dive review and/or offline study. |
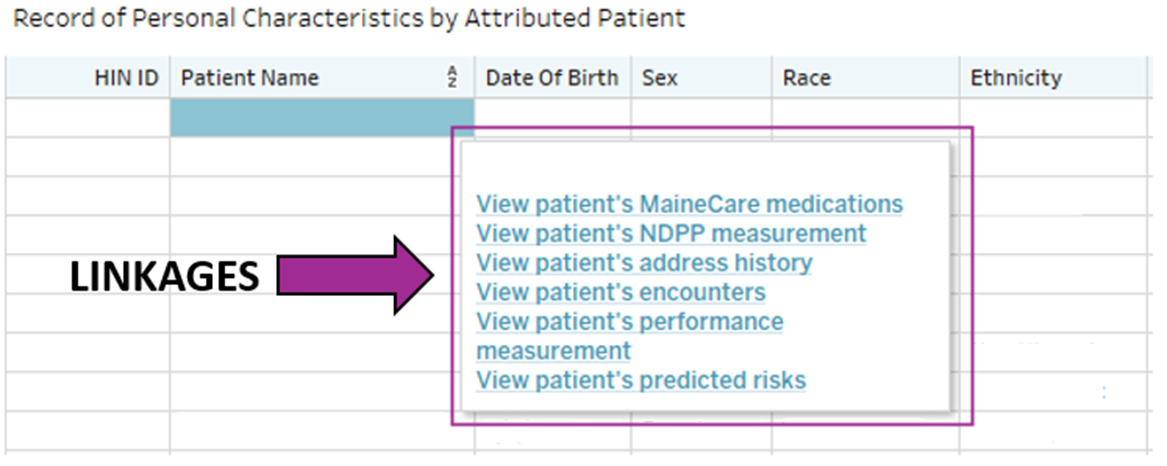
Linkages | Included in the tables available in detailed-level reporting dashboards are linkages from a specific patient’s record to other reporting dashboards where additional information is available for the same patient. For example, users reviewing a patient’s personal characteristics on the Patient Detail reporting dashboard may choose to “link” to the Risk Detail reporting dashboard to view the same patient’s predictive risk results. |
What’s Next?
Looking for additional information about some of the administrative underpinnings of the HARP reporting dashboards? Try using our HARP Utilities suite to learn more about the patient attribution and user permission configurations that build your access to critical patient insights within the service.