Service Controls
Overview
There are several service controls that perform key application functions across each reporting dashboard, including the ability to download data sets, optimize query performance, reverse filter selections, and more.
Control | Icon | Position | Section |
Undo |  | Lower-left corner | |
Redo |  | Lower-left corner | |
Revert |  | Lower-left corner | |
Refresh |  | Lower-left corner | This control is not currently relevant to the service |
Pause/Resume |  | Lower-left corner | |
Save
|  | Lower-left corner | |
Watch |  | Lower-right corner | This control is not currently relevant to the service |
Download |  | Lower-right corner |
Downloading Person-Level Information
Tabular views contained in the frontend reporting dashboards are available in a variety of export formats, including CSV and Crosstab files.
Select the "Download" icon located in the bottom-right corner of the screen.
Select the "Data" option to download a CSV-formatted file or the “Crosstab” option to download an Excel-formatted Crosstab file. Examples of each file format are provided below.
Within the “Summary” tab, select the option to “Download.”
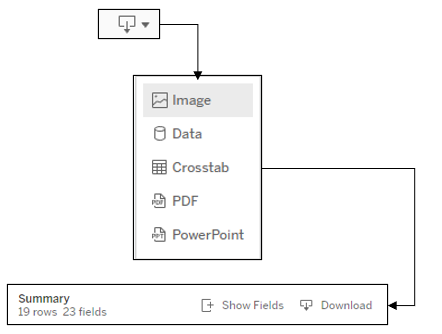
When attempting to export a tabular view, it may be necessary to interact with the frontend table before the Download option will allow users to export the “Data” or “Crosstab” format. Users can do so by selecting - then de-selecting - a cell in the table then trying to re-select the Download option.
Data (CSV) Format Example - Encounter Detail
Admission Date | MRN | Patient Name |
|---|---|---|
2024-07-29 | 1234 | Patient ABC |
2024-07-29 | 5678 | Patient DEF |
Crosstab Format Example - Encounter Detail
Admission Date | MRN | Patient Name |
|---|---|---|
2024-07-29 | 1234 | Patient ABC |
5678 | Patient DEF |
Performing Multiple Filter Selections
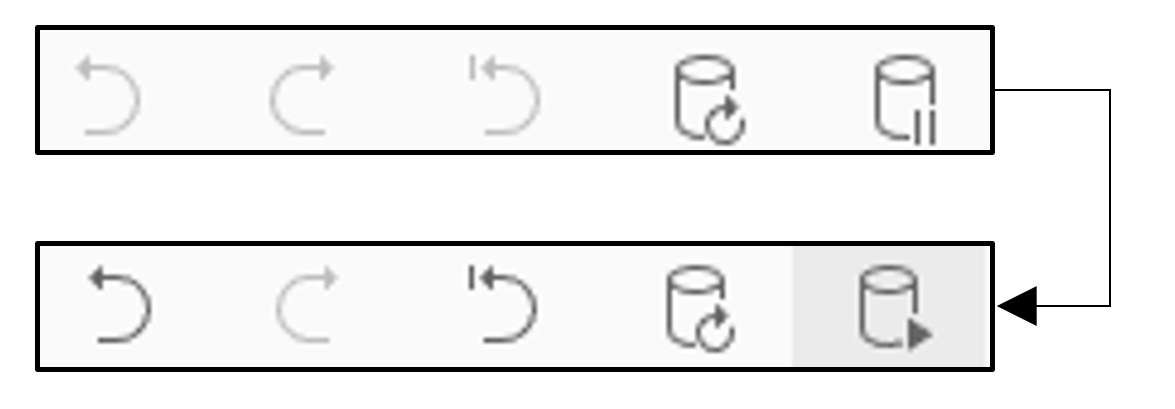
When attempting to perform multiple filter selections within a reporting dashboard, users can try selecting the “Pause” icon located in the lower-left corner of the view. Once the reporting has been paused, select all wanted filter criteria, then select the “Resume” button. In doing so, the reporting will refresh with all filter selections considered, rather than one at a time.
Reversing Filter Selections
Similar to other applications, the service provides users with the option(s) to undo (or redo) filter selections made within a reporting dashboard. By selecting the “Undo” icon, users can reverse the last filter selection made; alternatively, by selecting the “Redo” icon, users can make the last undone filter selection return. Additionally, when filter selections that have been made within a reporting dashboard become difficult to trace, users can select the “Revert” icon to return the service’s default settings.

Saving Reporting Dashboard Configurations
If a user has made filter selections in the reporting dashboards that they would like to leverage for future use, they can save the specific reporting configuration by selecting the “View” icon located in the lower-left corner of the screen.

Once the user selects the icon, a “Custom Views” window will appear where they can save the name of the configuration (“Name this view”), as well as choose whether they would like to have the configuration load each time that they open the reporting (“Make it my default”).
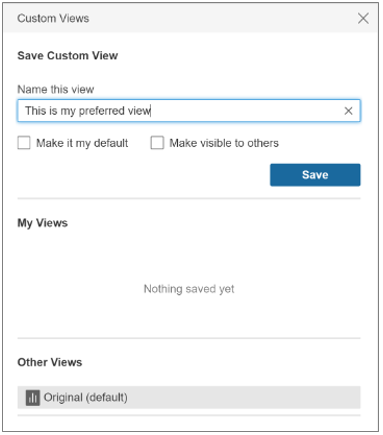
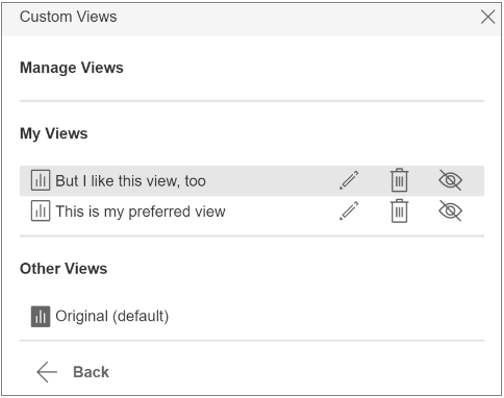
Over time, a user may choose to save many configurations of the reporting dashboards to examine e.g., specific person populations, utilization over specific admission date periods, etc. Within the same “Custom Views” window, the user can select which of the many configurations that they would like to load and review. Whereas the “My Views” section includes all of the custom configurations made by the user, the “Other Views” section includes the original configuration published by HealthInfoNet. By selecting one of the views from these sections, the reporting will refresh accordingly with the saved configurations.
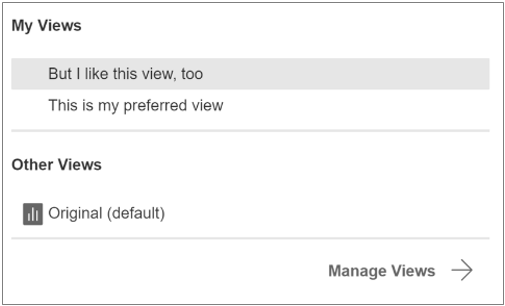
Additionally, users can select the “Manage Views” hyperlink located in the lower-left corner of the “Custom Views” window to edit all of their configurations. For example, they can choose to rename their saved configurations (by selecting the pencil icon) or delete their saved configuration altogether (by selecting the trash can icon) should they decide that it is no longer relevant to their work.
Periodically, actively used custom saved views are transitioned to a HIN-managed model to ensure they are preserved as updates are made to the platform. Users can access their custom views by searching under their organization’s name (i.e. PCHC: 2 Day View).
Functionality included in this feature to allow users to share their views with other users has been disabled for privacy and security purposes. The views that users customize within this reporting are therefore for their own consumption; other users within their organization hoping to create similar configurations will need to do so manually themselves.
