
HARP Population Health
Overview
HealthInfoNet’s Health Analytics Reporting Platform (HARP) Population Health contains a suite of use case-driven analytics tailored in collaboration with our HIE participants and Maine CDC to yield actionable insights for public health use cases.
Below is a brief overview of the reporting dashboards currently available to HARP Population Health users.
Reporting Dashboards
Title | Description |
|---|---|
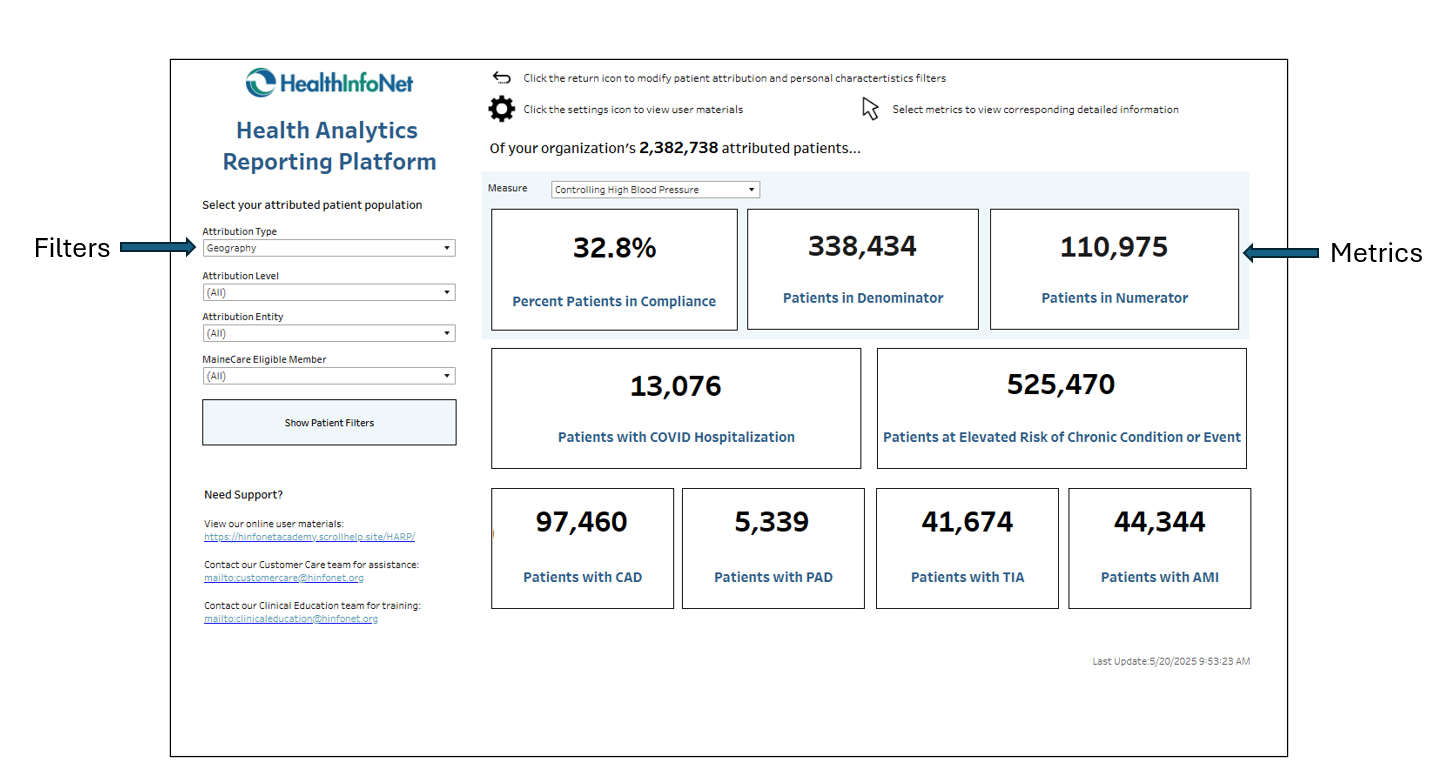
The Insights reporting dashboard provides a snapshot of aggregate metrics with drill-down functionality corresponding to key population health use cases. The dashboard offers a jumping-off point for users to target specific patient populations meeting use-case driven criteria to help improve understanding of their health-related risks, conditions, and outcomes alongside their community’s electronic Clinical Quality Measurement (eCQM) results. It also serves as a landing page for users to define the attributed patient populations that the subsequent reporting dashboard leverages in analyses. | |
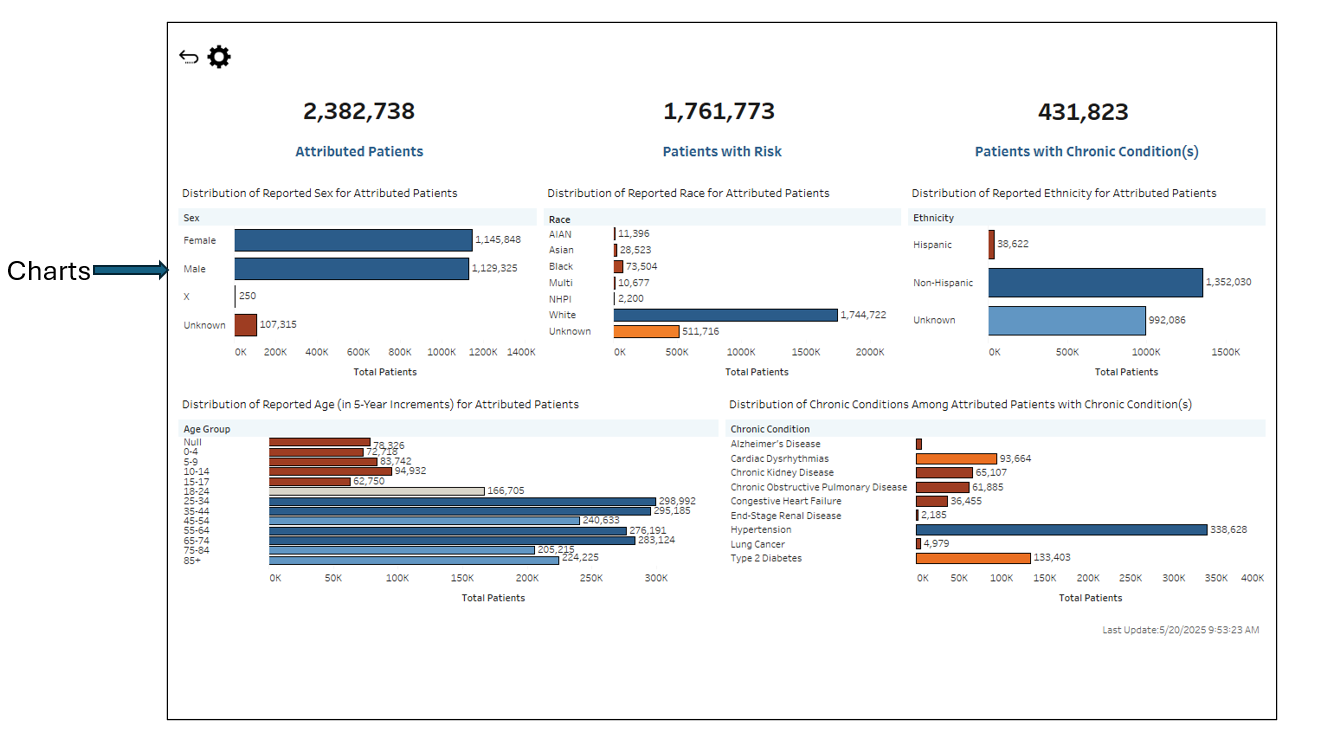
The Patient Profile reporting dashboard provides aggregate information about the personal characteristics of a user’s attributed patients, based on the filter selections made on the Insights dashboard. |
Service Components
There are several core components throughout HARP Population Health that compose the navigation, functionality, and design of the available reporting dashboards. Those components include Filters, Metrics, and Charts. The following sections provide information about the use of each component.
The annotated screenshots below visually identifies those components for reference.
Component | Description |
|---|---|
Filters | There are two primary means of refining the information available within reporting dashboards:
Note: When specific values are selected in one or more filters, other available filters' values may automatically limit to display only the remaining relevant values. For example, a user may select the “Male” value from the Sex filter. If the user subsequently wishes to limit their attributed patient population using the Race filter, the remaining values available in the filter will reflect the specific race categories of the user’s attributed Male patient population. For more information about how to use filters to optimize query performance and trace selections, visit the Service Controls section. |
Metrics | Included in each reporting dashboard are aggregate metric calculations that have been designed to help orient users as they begin to understand and interpret the information available within the views. |
Charts | Included in certain aggregate-level reporting dashboards are charts that help visualize key trends, patterns, and insights based on top use cases and workflows. |
What’s Next?
Looking for additional information about recent HARP releases? Check out our Release Notes.